profiler 6.0 helpComparing Memory SnapshotsTo see what objects have been created or released from the heap during a time interval, a Compare Memory Snapshots action is available. It allows to compare both saved and unsaved memory snapshots taken by the Profiler. Only comparable snapshots can be compared, this means that profiling type (Allocations vs. Liveness) and number of tracked objects must match for compared snapshots. There are two ways how to invoke Compare Memory Snapshots action: From the Profile MenuFrom the Profile menu you may compare any two snapshots saved to a file. Note that you have to provide comparable snapshots files otherwise the OK button stays disabled. 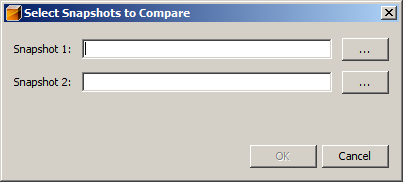
From a SnapshotMemory snapshot opened in the IDE can be easily compared with another comparable snapshot by using
the Compare Snapshot action ( 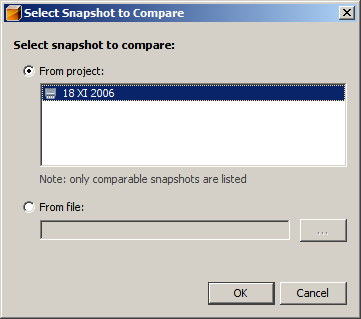
Snapshot comparator looks similar to a memory snapshot but it shows just the differences between two compared snapshots. Graphical bar displaying difference of bytes allocated starts in the middle of the cell and shows either green area to the left when allocated bytes value in second snapshot is lower or red area to the right when allocated bytes value in second snapshot is greater. Positive differences are marked by the + sign. 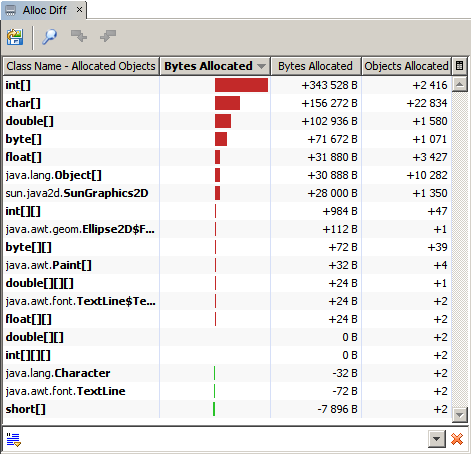
|
 ) in opened snapshot's toolbar.
A dialog will be opened which allows you to compare the snapshot with either other comparable snapshot taken
for the same project or with an external snapshot saved to a file.
) in opened snapshot's toolbar.
A dialog will be opened which allows you to compare the snapshot with either other comparable snapshot taken
for the same project or with an external snapshot saved to a file.