The NetBeans Profiler ProjectNetBeans Profiler is a project to provide a
full-featured profiling
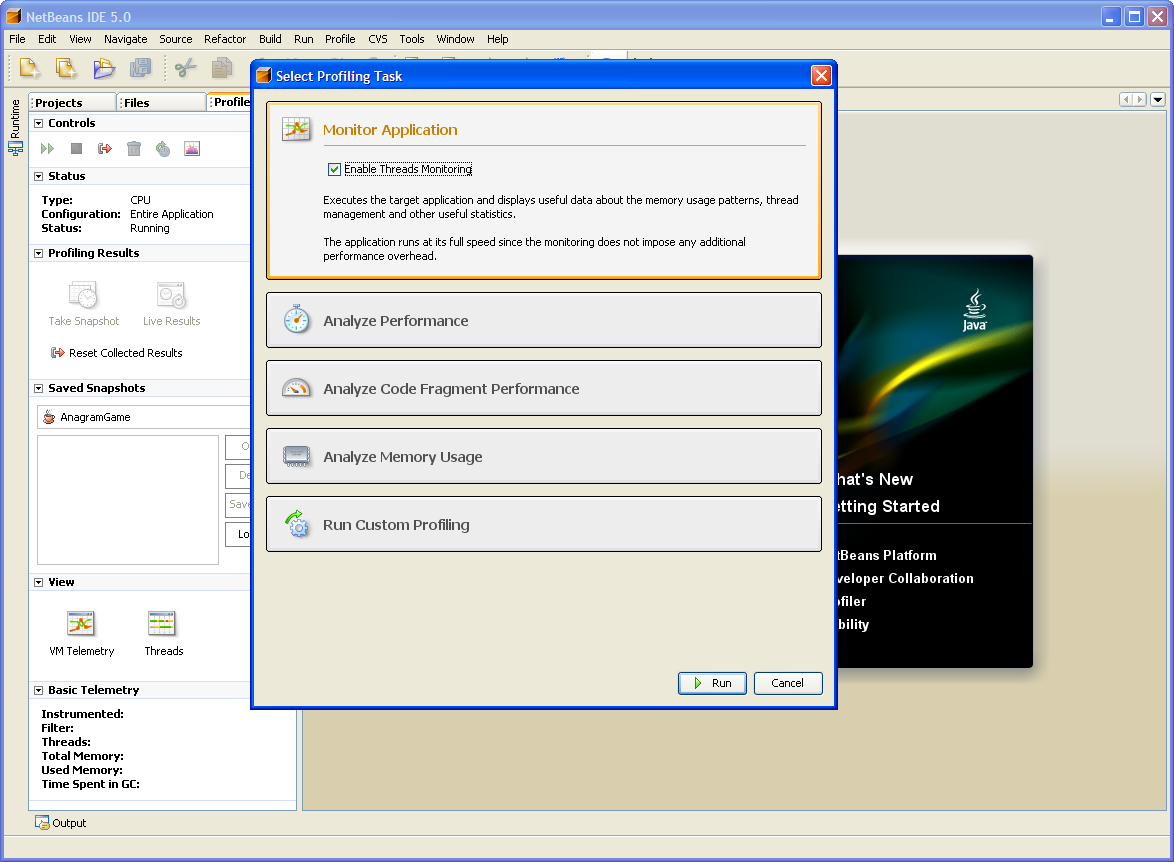
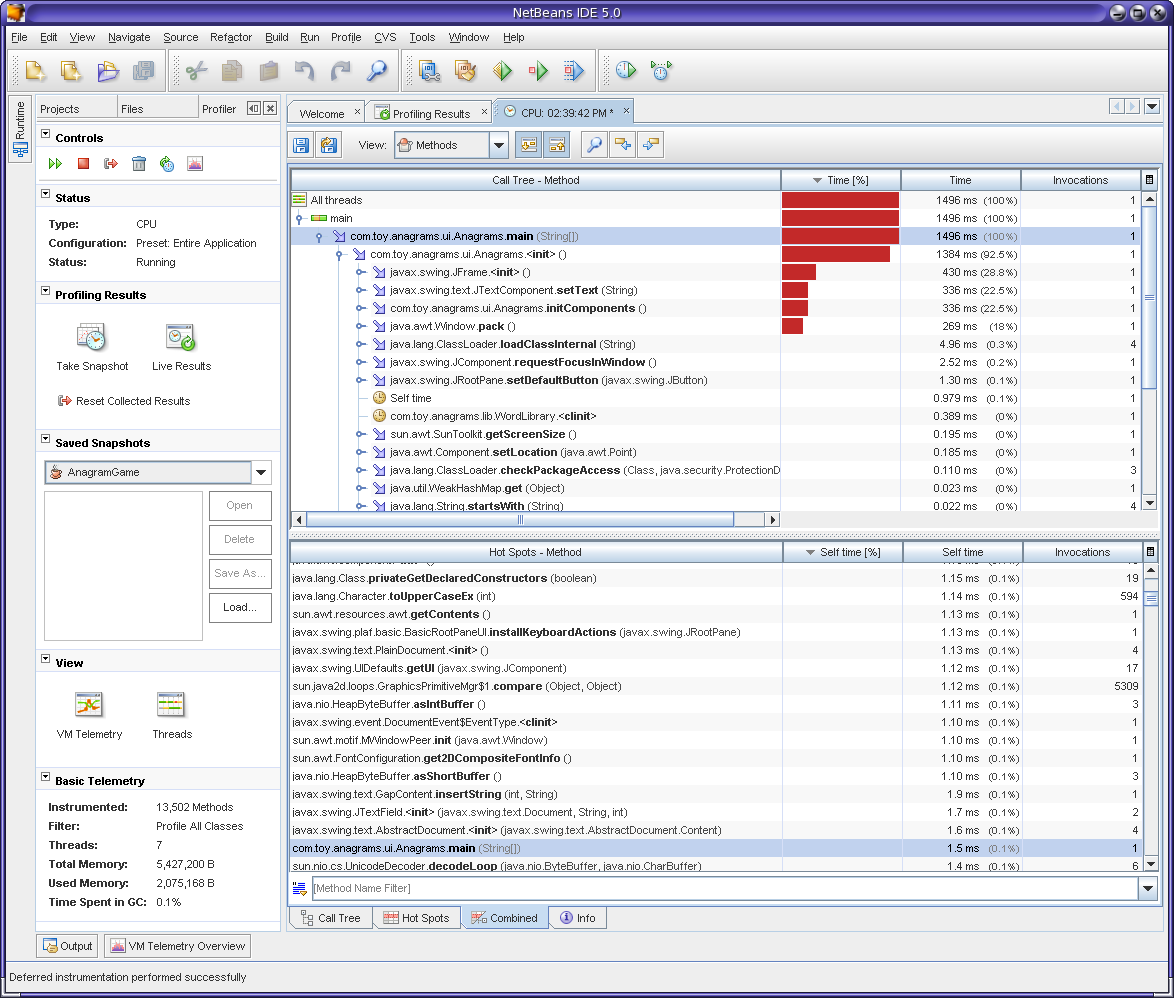
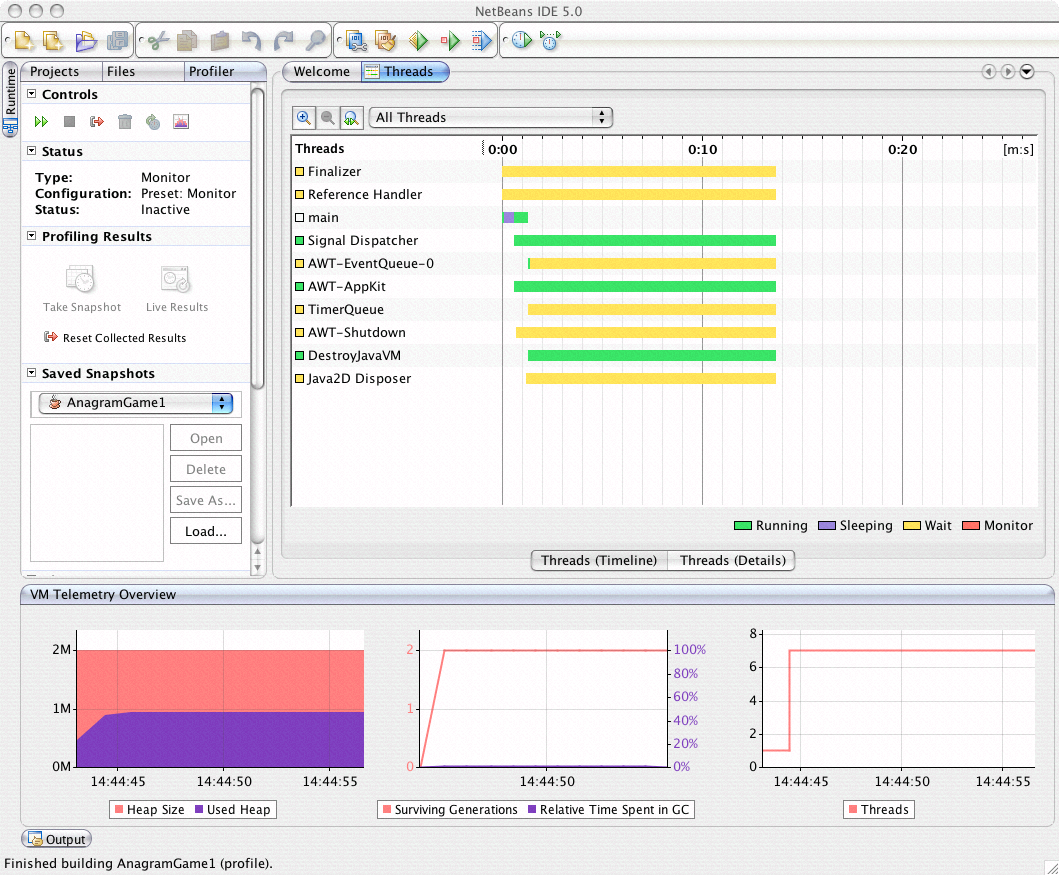
functionality for the NetBeans IDE. The profiling functions include
CPU, memory and threads profiling as well as basic JVM monitoring,
allowing developers to be more productive in solving memory or
performance-related issues.
Another tool being developed for profiling purposes is an integration of Visual GC into NetBeans IDE. For more details see the Visual GC Integration Module homepage. Learn
Download
LicensePlease note: Currently, the profiler.netbeans website only contains web content for the project, licensed under Common Development and Distribution License (CDDL). The profiler module, visualgc module, as well as the JFluid engine, the modified JVM and jvmstat libraries are only available in binary form under Sun Binary Code License (BCL). |