With its tight integration into the NetBeans IDE work flow,
the Profiler helps you build reliable and scalable applications.
Task-Based Profiling
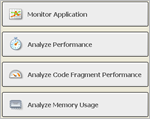 Select from several of the most common tasks, such as standard CPU or memory profiling, or simple monitoring.
The options are preset to default values by experts.
Only the application-specific options are exposed to you.
If you need to tune the tool's nuts and bolts, switch to custom profiling for full flexibility.
Select from several of the most common tasks, such as standard CPU or memory profiling, or simple monitoring.
The options are preset to default values by experts.
Only the application-specific options are exposed to you.
If you need to tune the tool's nuts and bolts, switch to custom profiling for full flexibility.
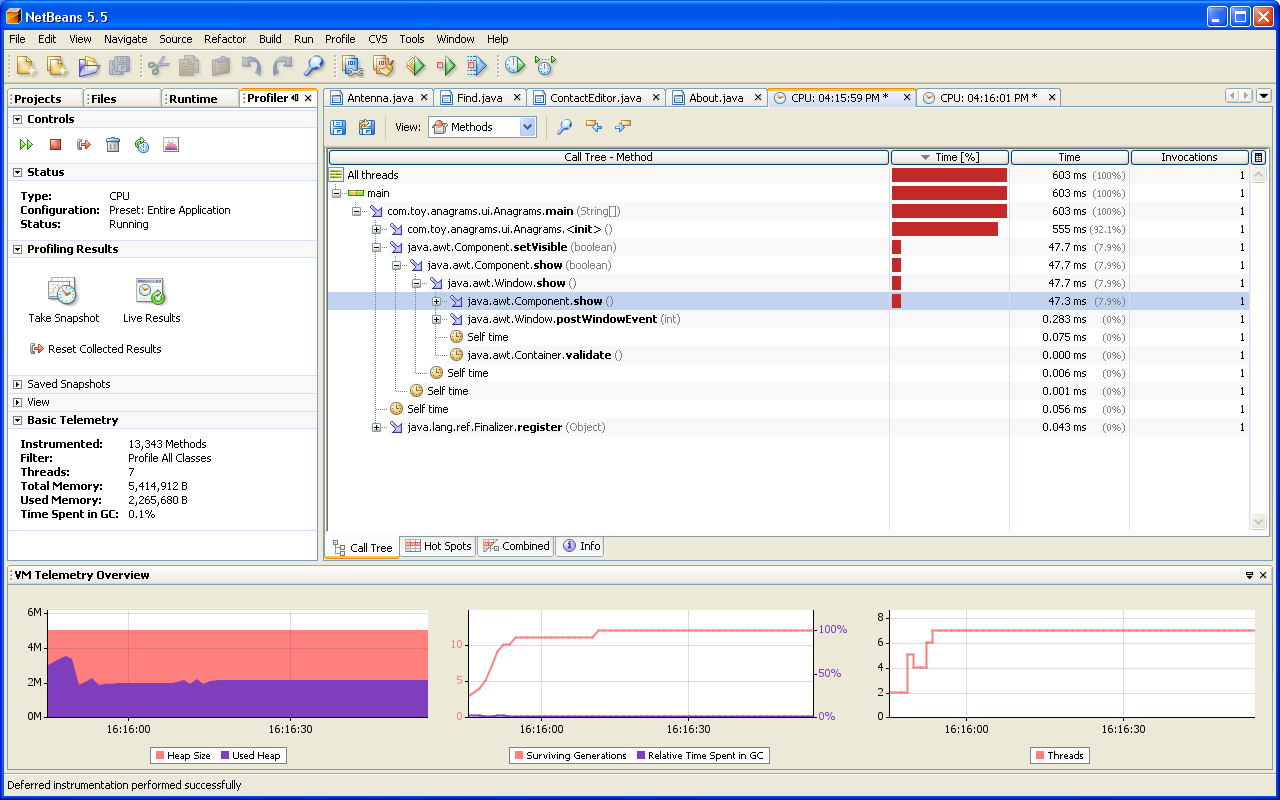
Speed up Performance
 The Profiler can be set up to report only on the methods in which you are interested.
Profile the entire application, or a subset, under a realistic workload.
Using dynamic bytecode instrumentation and additional algorithms,
the NetBeans Profiler obtains runtime information on applications
that are too large or complex for other profilers.
The Profiler can be set up to report only on the methods in which you are interested.
Profile the entire application, or a subset, under a realistic workload.
Using dynamic bytecode instrumentation and additional algorithms,
the NetBeans Profiler obtains runtime information on applications
that are too large or complex for other profilers.
Slim Down Memory Usage
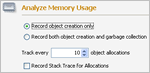 Pinpoint leaking objects based on their special pattern of allocations and garbage collections (or lack thereof).
Object liveness profiling tracks both object creation and garbage collection events.
See the number, age, allocation paths, and other characteristics of objects currently in memory.
Pinpoint leaking objects based on their special pattern of allocations and garbage collections (or lack thereof).
Object liveness profiling tracks both object creation and garbage collection events.
See the number, age, allocation paths, and other characteristics of objects currently in memory.
Untangle Your Threads
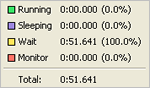 On the "Threads timeline" you follow threads activity side-by-side.
In "Thread details" you get detailed information about one or more selected threads,
including a list of all state changes in the thread life.
On the "Threads timeline" you follow threads activity side-by-side.
In "Thread details" you get detailed information about one or more selected threads,
including a list of all state changes in the thread life.
Attach the Profiler to a Remote Application
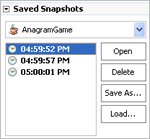 Attach and detach the profiler to a remote process.
When the profiler is detached, there is no instrumentation in the application, and thus no overhead.
Collect data for offline processing by saving snapshots of collected results for later.
Attach and detach the profiler to a remote process.
When the profiler is detached, there is no instrumentation in the application, and thus no overhead.
Collect data for offline processing by saving snapshots of collected results for later.
Learn More